Data Visualization
Overview of data visualization
Data visualization is an art where the practitioner transform data from the abstract form to a concrete graph. Using colors, shapes , sizes and many other glyphs the informations can be more effectively percieved by the observer. My interest in data visualization rised when i was and still envolved in a machine learning project . When working with multi-dimensional data, i needed to see how each dimension (feature) effect the ouput of my algorithm. I always turn to books to seek informations, and one of the most recommended auther was Edward Tufte , who wrote several books in topics.
A picture is Worth a thousand words
this illustration made by “Charles minard” , 1869 demonstrates how we can represent a big volume of informations in a single picture.
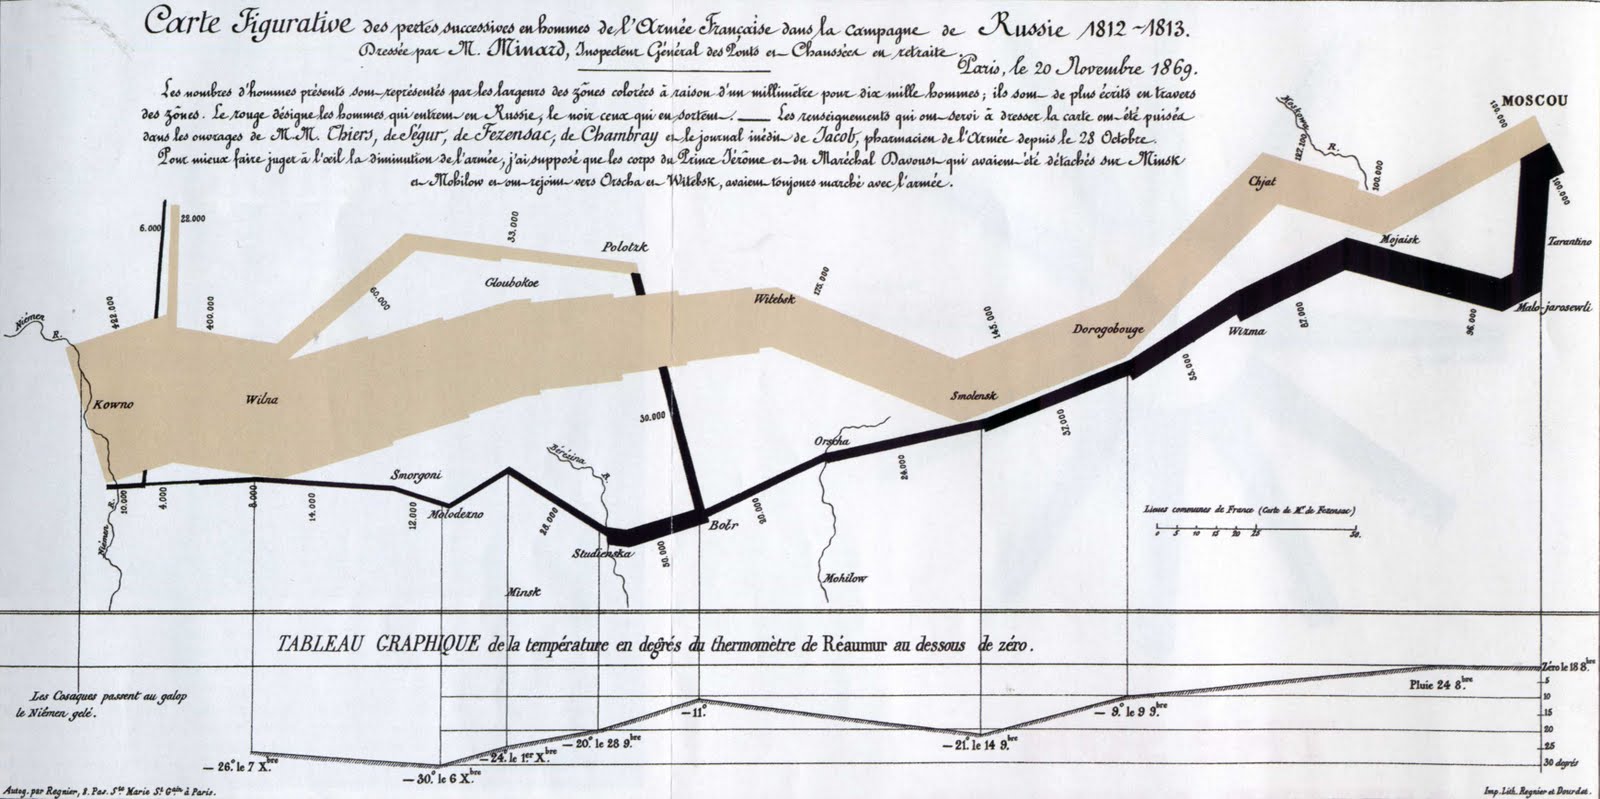
it is very old illustration of Napolian’s army as it’s marching toward moscow. The width of the line is the size of the army.The direction is to Moscow, and it’s withered down to a small size compared to what it started with. the second black line is the retreat, we see that the size of the army becomes even smaller, in part because of the falling temperatures which are plotted down.